

[Complete Guide] The Most Important eCommerce Metrics For Growth with Brendan Gillen
[Complete Guide] The Most Important eCommerce Metrics For Growth with Brendan Gillen

Knowing how your store and marketing initiatives are performing is one of the fundamental keys to growing your eCommerce business. But with so many lists of essential metrics to track, it is hard to know which metrics are the most important, for what reason, and how to measure them. Today I’m talking to Brendan Gillen from the eCommerce Factory, a specialist eCommerce advisory that helps stores grow from $0-$1m and above. Read on.
What are the most important metrics for eCommerce stores?
In my opinion, the primary trinity of eCommerce growth metrics are:
Traffic and Sessions
Conversion Rate, (CVR), and;
Average Order Value (AOV)
Conversion Rate: The number of conversions divided by interactions. E.g. 100 visits, with 10 conversions or sales, equals 10% conversion.
Average Order Value: For a period of time, the total value of orders made is divided by the total number of transactions. E.g. $1,000 in sales over 20 transactions in one month, equals an AOV of $50.
These are the main growth levers of your eCommerce business. By changing one, or a combination of multiple, this is what will really grow your ecommerce business.
The benefit of these is also that you can use them to help better forecast your business revenue. You can see that if you double your traffic, and the quality or response of that traffic is the same in their CVR and AOV, then you will be able to estimate the revenue your business will make as double.
What other areas should you measure?
In terms of broad categories, you should also be measuring and monitoring behavioral, customer journey, and long-term growth metrics.
Behavioral Metrics
The most important behavioral metrics for eCommerce are:
Bounce Rate
Time on Site
Exit Rate
Bounce Rate: This is the percentage of people who land on a page or your website and leave without engaging in another action such as moving to another page.
Time on site: Is the total number of seconds, minutes and hours that someone stays on your website.
Exit Rate: Is the percentage of people who leave your site from a certain page.
Measuring your bounce rate helps you understand whether you are sending the right audience to the right pages. If your bounce rate is high then you can adjust the location or products that you are promoting to that audience and increase engagement.
Time on site shows both positive and negative experiences for users. And it can also depend on the brand. A long time on site can show that users are engaged and interested in your products. But if they aren’t converting, it could also show that they are struggling to find what they are looking for.
In the alternative, if they are staying for a short time but converting well, then the short time on site is actually positive rather than negative.
The exit rate is basically the marker that helps you see whether people are finding what they want. Too high of an exit rate would usually be present along with a low conversion rate.
Key Customer Journey Metrics
Ultimately there are about 5 key customer journey metrics. These are the points at which people move through the sales funnel:
Visits to the site
% users who navigate to a product page
% users who click add to cart
% users who go to check out
% of users who purchase
Measuring each of these points will help you keep track of where the breaks in your funnel are.
For example, if you see that a large percentage of users are navigating to your product page/s, but not adding to cart, then you know your team needs to drill down and work out why that is. It could be as simple as an error on the page or as complex as needing to reposition your product or offer.
Long Term Growth Metrics
The essential long term growth metrics are:
Lifetime Value (LTV)
Purchase Frequency
Lifetime Value: A customer’s LTV is the total revenue value of a customer over the customer’s typical relationship with the business. For example, if a customer typically buys $500 worth of goods over 1 year, then the LTV of that customer is $500.
Purchase Frequency: Is defined as the rate at which people generally make a second, third or other additional purchase. It is calculated by dividing the total number of orders by the number of unique customers. For example, if you had 110 orders, over 100 customers, your purchase frequency would be 1.1.
These growth metrics apply differently depending on the brand, but generally speaking, you will need to keep an eye on your LTV and purchase frequency for long-term growth.
LTV will tell you whether you are engaging shoppers to come back more and more, either through upsells, cross sells, down sells or replenishment purchases. This is especially important in subscriptions or categories that lend themselves to ongoing purchases like supplements.
Purchase frequency gives you insight into whether or not your promotions and additional selling offers are effective at bringing people back to purchase again within a selected time frame.
What are the key metrics for paid ads?
Paid ads can use the main three key metrics suggested earlier (traffic, conversion rate and average order value), but should also be reviewed within the context of these 4 key metrics:
Return On Ad Spend (ROAS)
Impressions
Click Through Rate (CTR)
Cost Per Acquisition (CPA)
Return On Ad Spend: ROAS is calculated as the total revenue from sales generated by ads, divided by the total money spend on the ads themselves.
Click-Through Rate: CTR is defined as the percentage of people who see an ad, page, or some other element and click through.
Impressions and clicks are a key lever for helping you optimise your campaigns.
Think of Google Shopping, for example. If you know you are getting lots of impressions but no clicks, it may mean that there is demand for your category but your product is not enticing enough. You can then iterate the offering, title, pricing, offer etc. to try improve this.
Lots of clicks, but low impressions on the other hand, can help you to know to increase your impressions by increasing bids or budgets to raise the amount of impressions and get more from your advertising.
How should you track these eCommerce metrics?
I like to recommend the Switzerland of Analytics, Google Analytics (GA). It’s free and it is practically accurate (not 100%, but close enough) for professional use, most of the time.
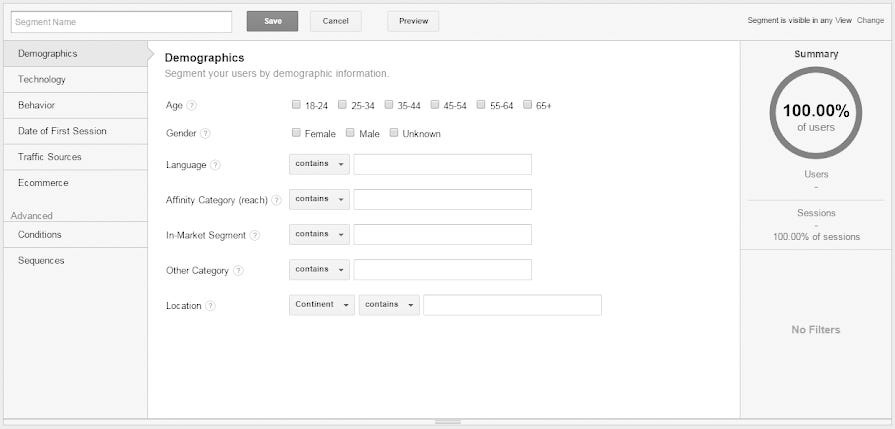
A great benefit of Google Analytics is that you can use GA to split up the data any way you like, with custom segments.
It is definitely the place I recommend most people get started.
How do you create eCommerce dashboards?
First, moving up to dashboards is another level of complexity from GA. Start with GA and it’s out of the box functions and dashboards if you are just getting your feet wet.
If you feel comfortable and have the resources to increase the complexity, I recommend Google Data Studio (GDS).
GDS is unique in that it is free, and it will allow you to collect data from multiple sources such as YouTube, Google Ads, and plenty of other places using different and sometimes paid extensions. Everything will tie into one place and make reviewing your KPIs easy.
How do you use benchmarks?
Personally, I don’t believe benchmark data is particularly useful, logically speaking.
If you know that the performance for your campaign, website or advertising is below the benchmark, your conclusion will be that you will need to improve the performance. But just the same, if your performance is above the benchmark, you won’t stop there, and will need to continue improving your performance anyway. It’s the same conclusion.
The main thing is to record your performance and make sure you are improving it every week.
What is your suggested Analytics and performance measurement routine?
For most stores, a weekly cadence is going to be the right frequency for reviewing your performance data. Personally, I check most of my stats on a Monday on our dashboards (see above) and compare these to our previous week’s performance.
When you are in heavier campaign seasons, such as Black Friday and Cyber Monday, you will want to check your stats daily.
How should people connect with you?
🎯 People can connect with me on LinkedIn or check out our website The eCommerce Factory. We are running a program called The Million Dollar Store for those looking to grow their eCommerce business to their first 1m in revenue.